


Playwright Debugging Guide — Learn Playwright Debugging with Coding Masters and Subba Raju Sir
Debugging is an essential core link in automated testing. No matter how comprehensively you consider all factors when writing test scripts, it is difficult to guarantee that the script can run smoothly every single time.
A locator fails to find the page element to be operated on, the timing of script execution does not align with the page loading progress, an unexpected pop-up window or redirect appears.
Or even the input data used for testing is filled in incorrectly — any of these minor issues can cause a properly written script to fail directly.
This Playwright Debugging Guide is designed to help testing professionals learn how to quickly identify these problems, clearly analyze their causes and consequences, and finally resolve them smoothly.
If you participate in the hands-on training of Coding Masters and follow Subba Raju Sir to learn step by step, you will develop solid and practical debugging capabilities.
And can easily handle Playwright automation projects in real work scenarios.
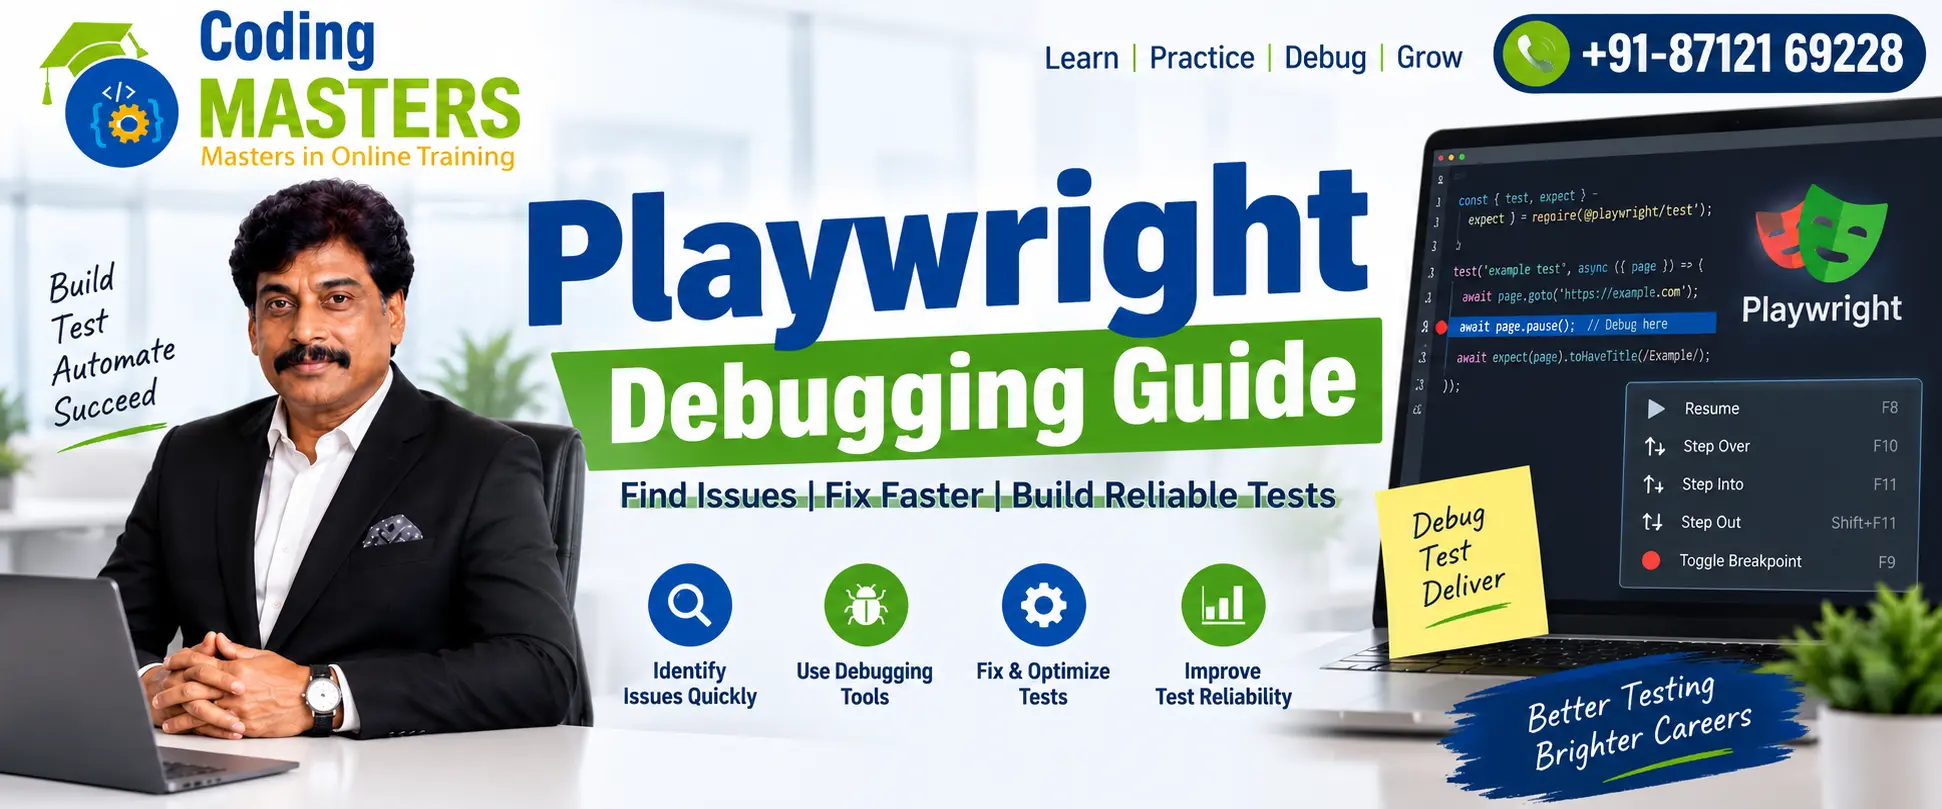
What Is Playwright Debugging?
In simple terms, Playwright debugging is the entire process of finding problems in the Playwright automation scripts you have written and then completely fixing these problems.
As long as your test fails to pass successfully, debugging work can help you accurately figure out at which step of the script execution the problem occurred, and what triggered this failure.
So that you will not be completely confused by the error messages.
Playwright Debugging Tools
Playwright itself comes with a complete set of practical debugging tools, including browser inspection functions that can check all page elements, breakpoints that pause the script at a specified location.
Trace viewing that can replay the full process recording of the script’s operation, screenshots that save the page state at the moment of failure, and screen recordings that capture all operations throughout the test.
Logs that record the running information of each step, and interactive debugging that allows manual troubleshooting while the script is running.
Together, these tools help you easily find out what went wrong with the failed test cases, and also make your entire automated testing process more stable and reliable.
Reducing the occurrence of inexplicable problems.
Why Debugging Skills Matter for Beginners
For newbies who have just entered the field, learning debugging is as important as mastering various operation commands of Playwright.
A tester who knows how to debug can quickly locate where the problem is, saving a lot of time wasted on aimless attempts.
If you do not know how to debug, you will only blindly modify the automation code repeatedly, trying dozens of times without ever figuring out the root cause of the problem, wasting energy in vain.
Why Is Debugging Important in Playwright Automation?
Automated testing cannot run successfully just relying on the segment of script you write; it relies on the cooperation of a series of interrelated links to work properly.
You need a browser to run the script, the target webpage to be tested, locators that can find page elements, test data for input, network requests transmitted between the browser and the server.
And the operating behavior of the application under test itself. Any problem in any of these links can directly lead to the failure of the entire test.
Identifying the Root Cause
If you know how to debug, you can sort out the current problem clearly: is the fault caused by the locator that finds elements?
Is the synchronization between the script and the page not aligned? Is there a bug in the application under test itself?
Is there something wrong with the browser configuration? Or is there a loophole in the test script I wrote myself?
By categorizing the problem, you will not waste time guessing randomly among a pile of possibilities, and you can fix the problem from the root.
Improving the quality of the entire automation project.
Debugging Dynamic Web Applications
Debugging is especially critical if you are testing dynamic web applications.
Unlike the static webpages of the early years that loaded all content as soon as they were opened, many elements on these modern webpages may only load gradually after the user performs specific operations.
Such as clicking or scrolling; other webpage contents are updated frequently, and the position of elements today is different from that of tomorrow.
Such dynamic pages are inherently prone to test failures, which makes the role of debugging even more prominent.
Playwright Debug Mode
One of the most practical contents in this Playwright Debugging Guide is learning how to run tests in debug mode.
After enabling this mode, Playwright allows testers to pause the running test at any time, check every detail during the test execution, and figure out exactly what is happening.
Using Playwright Inspector
With the built-in Playwright Inspector, testers can also clarify the order in which the automation scripts they wrote perform operations.
When the test is running, you can execute commands line by line, pausing after each step, and take the opportunity to check all elements on the page to verify that they match your expectations.
Debugging Intermittent Failures
If your test encounters a particularly tricky situation — it can run smoothly sometimes but fails inexplicably at other times, this debug mode will come in handy.
You do not have to guess the cause of the error blindly. Instead, you can directly enable debug mode to observe the running process of the application.
And accurately locate the specific node where the problem first appeared, so you no longer have to troubleshoot in the dark.
Debugging with Breakpoints
The breakpoint function allows testers to pause the execution of the entire test at any position they specify.
The advantage of this is that you can check the current state of the application before performing the next operation, and confirm that everything is correct before continuing to run.
Debugging a Login Test
Let’s take a practical example: if the login test you wrote fails every time after entering the account and password, you can set a breakpoint one step before clicking the login button.
So that the script stops there. Then you can check in person: are the contents filled in the username and password input boxes the correct values you preset?
Is that login button fully loaded and able to trigger the click operation normally?
Understanding Application State
The core use of breakpoints is to help you see the real state of the application during the test run, instead of always relying on your subjective assumptions to infer the problem.
Debugging Locator Issues
Locator problems are one of the most common causes of Playwright test failures.
Many times the test cannot proceed simply because the locator you wrote fails to correctly identify the target element that the script needs to operate on.
Playwright Locator Strategies
Playwright itself supports several different locating strategies, including locating by role, by text, by label, by placeholder, and the commonly used CSS selectors.
Testers should prioritize stable and reliable locating methods, and personally verify that these locators work properly during debugging.
Investigating Failed Locators
If your locator does fail, debugging tools can help you find out the problem clearly: is the target element simply non-existent, or is it hidden by the page?
Did the locator misidentify another element, or did it load later than you expected, so the script reported an error before it could load?
Handling Timing and Synchronization Issues
Nowadays, the vast majority of websites do not load all content at once when the page is opened, but dynamically render new content little by little as the user operates.
This model can improve the user’s browsing experience, but when it comes to automated testing, it is very prone to problems.
If the automation script you write is too hasty, and clicks on the element to be operated on the page before it is fully loaded and ready to receive operations, the test will fail.
All these problems are caused by incorrect timing.
Playwright Auto-Wait Mechanism
Playwright comes with an auto-wait mechanism that helps solve most of these synchronization problems.
It will wait for the element to meet the operable conditions before executing the next script command, so testers do not have to worry about the waiting logic in most scenarios.
But even with this thoughtful automatic mechanism, testers still need to understand how this waiting logic works, so that when a problem does occur, they can troubleshoot the root cause of the failure themselves.
Checking Element Conditions
When you do encounter such a test failure related to timing, you can check the problematic element item by item during debugging: is it normally visible on the page?
Is it already in an enabled state that allows clicking? Is it really loaded and mounted on the current page?
Are all conditions met and ready to receive operations at any time?
Avoiding Fixed Waiting Times
Troubleshooting problems with this item-by-item verification method is far more reliable than hardcoding a fixed waiting time in the script.
Such as adding a line of “wait 3 seconds before operating”. It avoids the problems of the element not being loaded because the waiting time is too short.
Or wasting test time because the waiting time is too long.
Using Screenshots and Videos
When a test fails, screenshots and screen recordings are two very useful debugging materials.
As long as the test fails, the automatically saved screenshot at that moment can directly show the visual state of the page of the application under test at the second of the failure.
You can see at a glance what popped up or got stuck on the page at that time, without having to guess for a long time based on logs.
Benefits of Screen Recordings
Screen recordings provide additional information that screenshots cannot — they record all operations from the start of the test to the failure in chronological order.
You can follow the video to see what the script did step by step, and after which step the page started to have problems, connecting the causes and consequences of the failure.
These two types of materials are even more useful especially when encountering failures that are difficult to reproduce manually.
That is, problems that only occur occasionally when running automated tests, but never happen when you click through the page manually.
Combining Debugging Evidence
By analyzing materials such as screenshots, videos, running logs, and Trace records together, you can clearly understand the ins and outs of why this automated test failed.
Without missing any hidden details.
Playwright Trace Viewer
Playwright Trace Viewer is another very important built-in debugging function of Playwright.
Even if your test has already finished running, whether it completed successfully or terminated due to failure, you can open this tool to retrieve and carefully check the entire execution process of the test.
Understanding Trace Records
The trace records read by Trace Viewer store all operations performed during the test, screenshots saved in the process, all network request activities throughout the process.
The page state at every time point, and all other execution-related details.
With this complete record, you do not have to run the same test dozens of times to find the cause of the failure; you can figure out the problem just by looking at the records.
Importance of Trace Viewer
Therefore, in any professional Playwright Debugging Guide, learning how to use Trace Viewer is regarded as a core content.
Which is a skill that everyone who uses Playwright for automated testing must master.
Common Playwright Debugging Problems
In the process of using Playwright to write automated test scripts, you will most likely encounter a number of high-frequency common problems that are the most frequently reported and most likely to be encountered by testers.
Specifically, these include: the locator used to locate page elements is written incorrectly and cannot find the target, the script waits too long and triggers a timeout error.
The element to be operated on is not visible on the page and cannot be interacted with, an unexpected page redirect suddenly appears during the test.
There is a problem with the identity authentication link of the login system and the process cannot continue, or the input data used for testing itself has errors.
Causing the entire process to fail to run.
Understanding Error Messages
To solve these various problems, the first step must be to understand the error message popped up by the system.
Follow the prompts to find the root cause of the problem, and do not start randomly modifying large sections of test code without a clue.
Following a Systematic Debugging Process
The correct approach is to first lock in the specific operation that first triggered the error, determine which step failed to execute.
And then check the actual state of the application under test at that moment to see what is different from expectations.
Using a systematic process to troubleshoot Playwright problems can not only greatly reduce the time you spend finding and fixing problems.
But also make the automation scripts maintained by the team for a long time more stable, able to withstand hundreds of repeated calls, and not prone to strange errors frequently.
Best Practices for Playwright Debugging
During the process of developing and updating the Playwright automation framework, testers should abide by several core debugging principles, which can help you avoid many detours.
The first is to choose reliable locators to find page elements, and do not use writing methods that are prone to failure.
The second is to organize all test cases by functional module, and do not mix tests of different businesses together in a mess.
The third is to give each test case a clear and easy-to-understand name, so that others can tell at a glance which function this test case is for.
The fourth is to automatically save a screenshot of the page at the moment of failure as a record whenever a test fails.
The fifth is, when encountering a complex problem whose root cause cannot be found, review the complete execution track of the script to sort out the causes and consequences.
Reproducing Failures Before Fixing
There is another particularly critical point: as long as conditions allow, first stably reproduce the failure scenario before you start modifying the code.
If even the failure is a matter of luck — it can run through sometimes and fail at others, troubleshooting will only be twice as effective with half the effort.
If you first clarify what the normal performance of this function should be, and then compare it one by one with the actual state of the test environment, the difficulty of debugging will be greatly reduced immediately.
Maintaining Clean Automation Code
In addition, writing all the automation code in all test suites cleanly and consistently, in line with the team’s coding specifications, can also reduce many unnecessary script errors and execution failures.
Saving you from wasting precious time on avoidable low-level problems.
Learn Playwright Debugging at Coding Masters
Coding Masters has specially launched a hands-on training camp for all testing professionals who want to improve their Playwright automation capabilities and troubleshooting skills.
The training camp does not teach automation knowledge points and debugging separately; instead, it allows learners to study debugging skills and the core concepts of Playwright simultaneously.
So that students can truly understand how professional testing teams solve most common script failures before they affect the release progress, and avoid launching products with problems.
Practical Playwright Training
The entire course is led by Subba Raju Sir.
All students focus on practical Playwright concepts, implementable automation technologies, reusable debugging methods throughout the course, and can also access real online project scenarios.
Instead of learning a bunch of theoretical knowledge that only works for exams.
The solid hands-on project experience helps every learner not only write a barely usable test script, but also perform daily maintenance, regular inspections, and rapid repairs after problems occur throughout the entire lifecycle of the script.
Why learn Playwright with Subba Raju Sir?
Subba Raju Sir has integrated more than ten years of rich front-line professional testing experience into the course content.
The entire course syllabus is centered on real projects, prioritizing all high-frequency scenarios encountered in the real workplace, and will not teach impractical empty theories.
Students can thoroughly learn core automation concepts through tangible real project cases, and also learn how to seamlessly integrate debugging skills into daily software testing processes.
They will not debug for the sake of debugging, but let debugging truly serve the entire testing work.
Building Problem-Solving Skills
By practicing troubleshooting capabilities as the core content of Playwright skill learning, you will be more confident when you take over large and complex test suites in the future.
And handle intricate project scenarios, and will not panic when encountering problems.
This set of hard problem-solving skills you have developed is applicable to almost all QA positions that rely on test automation, and can be used in any company.
Final Summary
A comprehensive and sufficient Playwright debugging guide can help all testers quickly find and completely solve automation problems before they interfere with core release tasks.
Preventing small script problems from becoming major accidents that affect the launch.
Playwright’s native tools such as Playwright Inspector, breakpoints, screenshots, videos, logs, and Trace Viewer allow you to locate and fix problems much faster.
So you no longer have to rely on guesswork to find problems.
Building a Playwright Career
For professionals who want to develop practical Playwright skills that meet the requirements of enterprise positions, Coding Masters and Subba Raju Sir provide a structured and complete learning environment.
All course content focuses on automation design, error debugging, and real-scenario software testing, with no useless filler.
As long as you persist in regularly maintaining the Playwright scripts you write and repeatedly practice the ideas of troubleshooting errors, you can write more reliable test automation solutions.
And lay a solid foundation for your long-term career development in QA-related positions, and obtain better job opportunities.